Tidy Survival Analysis: Applying R’s Tidyverse to Survival Data

Module 3. Nonparametric Survival Analysis

Lu Mao

Department of Biostatistics & Medical Informatics

University of Wisconsin-Madison

Aug 3, 2025

Tabulating Survival Estimates

GBC: Relapse-Free Survival

  • Use dplyr to get time-to-first event
library(tidyverse) # Load tidyverse packages
# Load mortality + relapse data
gbc <- read.table("data/gbc.txt", header = TRUE)
df <- gbc |>  # calculate time to first event (relapse or death)
  group_by(id) |> # group by id
  arrange(time) |> # sort rows by time
  slice(1) |>      # get the first row within each id
  ungroup()     # remove grouping
# Display the first few rows of the data
head(df) 
# A tibble: 6 × 11
     id  time status hormone   age  meno  size grade nodes  prog estrg
  <int> <dbl>  <int>   <int> <int> <int> <int> <int> <int> <int> <int>
1     1 43.8       1       1    38     1    18     3     5   141   105
2     2 46.6       1       1    52     1    20     1     1    78    14
3     3 41.9       1       1    47     1    30     2     1   422    89
4     4  4.85      0       1    40     1    24     1     3    25    11
5     5 61.1       0       2    64     2    19     2     1    19     9
6     6 63.4       0       2    49     2    56     1     3   356    64

Raw Output from survfit()

  • KM estimates by hormone therapy
library(survival) # Load survival package
# Fit KM estimates by hormone group
km_fit <- survfit(Surv(time, status > 0) ~ hormone, data = df)
# summarize the KM fit object
summary(km_fit, times = c(6, 12, 24, 36))
Call: survfit(formula = Surv(time, status > 0) ~ hormone, data = df)

                hormone=1 
 time n.risk n.event survival std.err lower 95% CI upper 95% CI
    6    419       9    0.979 0.00691        0.966        0.993
   12    379      35    0.897 0.01476        0.868        0.926
   24    280      73    0.720 0.02203        0.678        0.764
   36    195      41    0.606 0.02475        0.559        0.656

                hormone=2 
 time n.risk n.event survival std.err lower 95% CI upper 95% CI
    6    236       4    0.983 0.00826        0.967        1.000
   12    223       8    0.950 0.01418        0.922        0.978
   24    177      38    0.785 0.02701        0.733        0.839
   36    136      16    0.708 0.03047        0.650        0.770

Extracting Survival Estimates

  • Elements in survfit object
    • time: time points of the survival estimates
    • surv: survival probabilities at the time points
    • lower, upper: confidence intervals for the survival estimates
    • strata: stratification information (if applicable)

Exercise

Create a table of survival estimates with 95% confidence intervals at 6, 12, 24, and 36 months for each hormone therapy group using dplyr and tibble.

Tidying survfit() Output

  • Use broom package to tidy survfit objects
    • broom::tidy() converts the survfit object into a tidy data frame
    • Useful for further analysis or visualization
library(broom) # Load broom package
tidy(km_fit) # Tidy the KM fit object
# A tibble: 613 × 9
    time n.risk n.event n.censor estimate std.error conf.high conf.low strata   
   <dbl>  <dbl>   <dbl>    <dbl>    <dbl>     <dbl>     <dbl>    <dbl> <chr>    
 1 0.262    440       0        1    1       0               1    1     hormone=1
 2 0.525    439       0        1    1       0               1    1     hormone=1
 3 0.557    438       0        2    1       0               1    1     hormone=1
 4 0.590    436       0        1    1       0               1    1     hormone=1
 5 0.951    435       0        1    1       0               1    1     hormone=1
 6 1.87     434       0        1    1       0               1    1     hormone=1
 7 2.13     433       0        1    1       0               1    1     hormone=1
 8 2.20     432       0        1    1       0               1    1     hormone=1
 9 2.33     431       0        1    1       0               1    1     hormone=1
10 2.36     430       1        0    0.998   0.00233         1    0.993 hormone=1
# ℹ 603 more rows

Tabulation with gtsummary

  • Main function: tbl_survfit()

    • Takes on survfit object
    • Creates a table of survival estimates with confidence intervals
    • Automatically handles stratification and time points
    library(gtsummary) # Load gtsummary package
    # Create a table of survival estimates
    km_fit |> tbl_survfit(                    # Pass `survfit` object
                 label = "Hormone",           # Row label: "Hormone"
                 times = c(6, 12, 24, 36),     # Time points for estimates
                 label_header = "Month {time}" # Column label: "Month xx"
                 ) 
    Characteristic Month 6 Month 12 Month 24 Month 36
    Hormone


        1 98% (97%, 99%) 90% (87%, 93%) 72% (68%, 76%) 61% (56%, 66%)
        2 98% (97%, 100%) 95% (92%, 98%) 78% (73%, 84%) 71% (65%, 77%)

Grouping by Multiple Variables

  • Pass raw data to tbl_survfit()
df |>                                       # Use raw data
  tbl_survfit(y = Surv(time, status),       # Survival object
              include = c(meno, grade),     # Include variables: menopause, grade
              label = list(meno = "Menopause", # Row labels
                          grade = "Tumor grade"),
              times = c(6, 12, 24, 36),     # Time points for estimates
              label_header = "Month {time}" # Column label: "Month xx"
             ) 
Characteristic Month 6 Month 12 Month 24 Month 36
Menopause


    1 98% (96%, 99%) 90% (86%, 93%) 73% (68%, 78%) 65% (59%, 71%)
    2 98% (97%, 100%) 93% (90%, 96%) 75% (71%, 80%) 64% (59%, 69%)
Tumor grade


    1 100% (100%, 100%) 100% (100%, 100%) 93% (87%, 99%) 84% (75%, 93%)
    2 98% (97%, 100%) 92% (90%, 95%) 75% (71%, 80%) 64% (60%, 69%)
    3 96% (93%, 99%) 85% (80%, 91%) 63% (55%, 71%) 55% (48%, 64%)

Tabulating Quantile Estimates

  • Quantile estimates: Median survival time, quartiles, etc.
    • Specify probs argument in tbl_survfit()
# Create a table of quantile estimates
km_fit |>                        # Pass `survfit` object
  tbl_survfit(
    label = "Hormone",           # Row label: "Hormone"
    probs = c(0.25, 0.5, 0.75),  # Quantiles: 25%, 50%, 75%
              label_header = "{100 * prob}% quantile") # Column label: "xx quantile"
Characteristic 25% quantile 50% quantile 75% quantile
Hormone


    1 21 (18, 25) 50 (42, 59) 81 (81, —)
    2 28 (23, 39) 66 (63, —) — (—, —)

Exercise: Tabulating Quantiles

  • Create the following table
Characteristic 25% quantile 50% quantile 75% quantile
Menopause


    1 21 (18, 27) 66 (52, —) — (—, —)
    2 24 (21, 28) 56 (49, 65) — (81, —)
Tumor grade


    1 48 (38, —) — (65, —) — (—, —)
    2 24 (21, 28) 57 (49, 67) — (81, —)
    3 16 (13, 19) 44 (31, —) — (67, —)
Solution
df |>                                       # Use raw data
  tbl_survfit(y = Surv(time, status > 0),   # Survival object
              include = c(meno, grade),     # Include variables: menopause, tumor grade
              label = list(meno = "Menopause", grade = "Tumor grade"), # Row labels
              probs = c(0.25, 0.5, 0.75),   # Quantiles: 25%, 50%, 75%
              label_header = "{100 * prob}% quantile") # Column label: "xx quantile"

Customizing the Table

  • Customize table appearance
    • label_header: change column names
    • label: change row labels
    • statistic: customize statistics displayed
      • statistic = "{estimate} ({conf.low}, {conf.high})" for confidence intervals
  • More about gtsummary

Visualizing Kaplan-Meier Curves

Base Plot

Plot KM curves by hormone group
plot(km_fit, ylim = c(0,1), xlab = "Time (months)", ylab = "Relapse-free survival probability",
     col = c("red", "blue"), conf.int = TRUE)
# Add legend
legend(1, 0.2, col=c("red", "blue"), lty = 1, c("No hormone", "Hormone")) # Legend text
# p-value for log-rank test
pval <- survdiff(Surv(time, status) ~ hormone, data = df)$pvalue # obtain p-value
text(70, 0.8, scales::pvalue(pval, add_p = TRUE)) # Annotate formatted p-value

Enhanced Graphics with ggsurvfit

  • ggsurvfit: Provides a ggplot2 interface for survival curves
    • Takes on survfit object or raw data
    • add_risktable() adds a risk table below graph
    • Allows for more customization and aesthetics
library(ggsurvfit) # Load ggsurvfit package)
km_fit |> ggsurvfit()  # Pass `survfit` object

Customization (I)

  • Customize the plot with ggsurvfit
    • add_risktable(): Adds a risk table below the survival curve
    • add_confidence_interval(): Adds confidence intervals to the survival curve
    • add_pvalue(): Adds p-value for log-rank test
    • Other ggplot2 functions to further customize the plot
      • scale_x_continuous(), scale_y_continuous(), theme(), etc.

Customization (II)

  • Code
# survfit2() fits better with `ggsurvfit`
km_fit2 <- survfit2(Surv(time, status > 0) ~ hormone,  
                    data = df |> # Relabel hormone variable
                      mutate(hormone = if_else(hormone == 1, "No hormone", "Hormone")) 
                      ) 
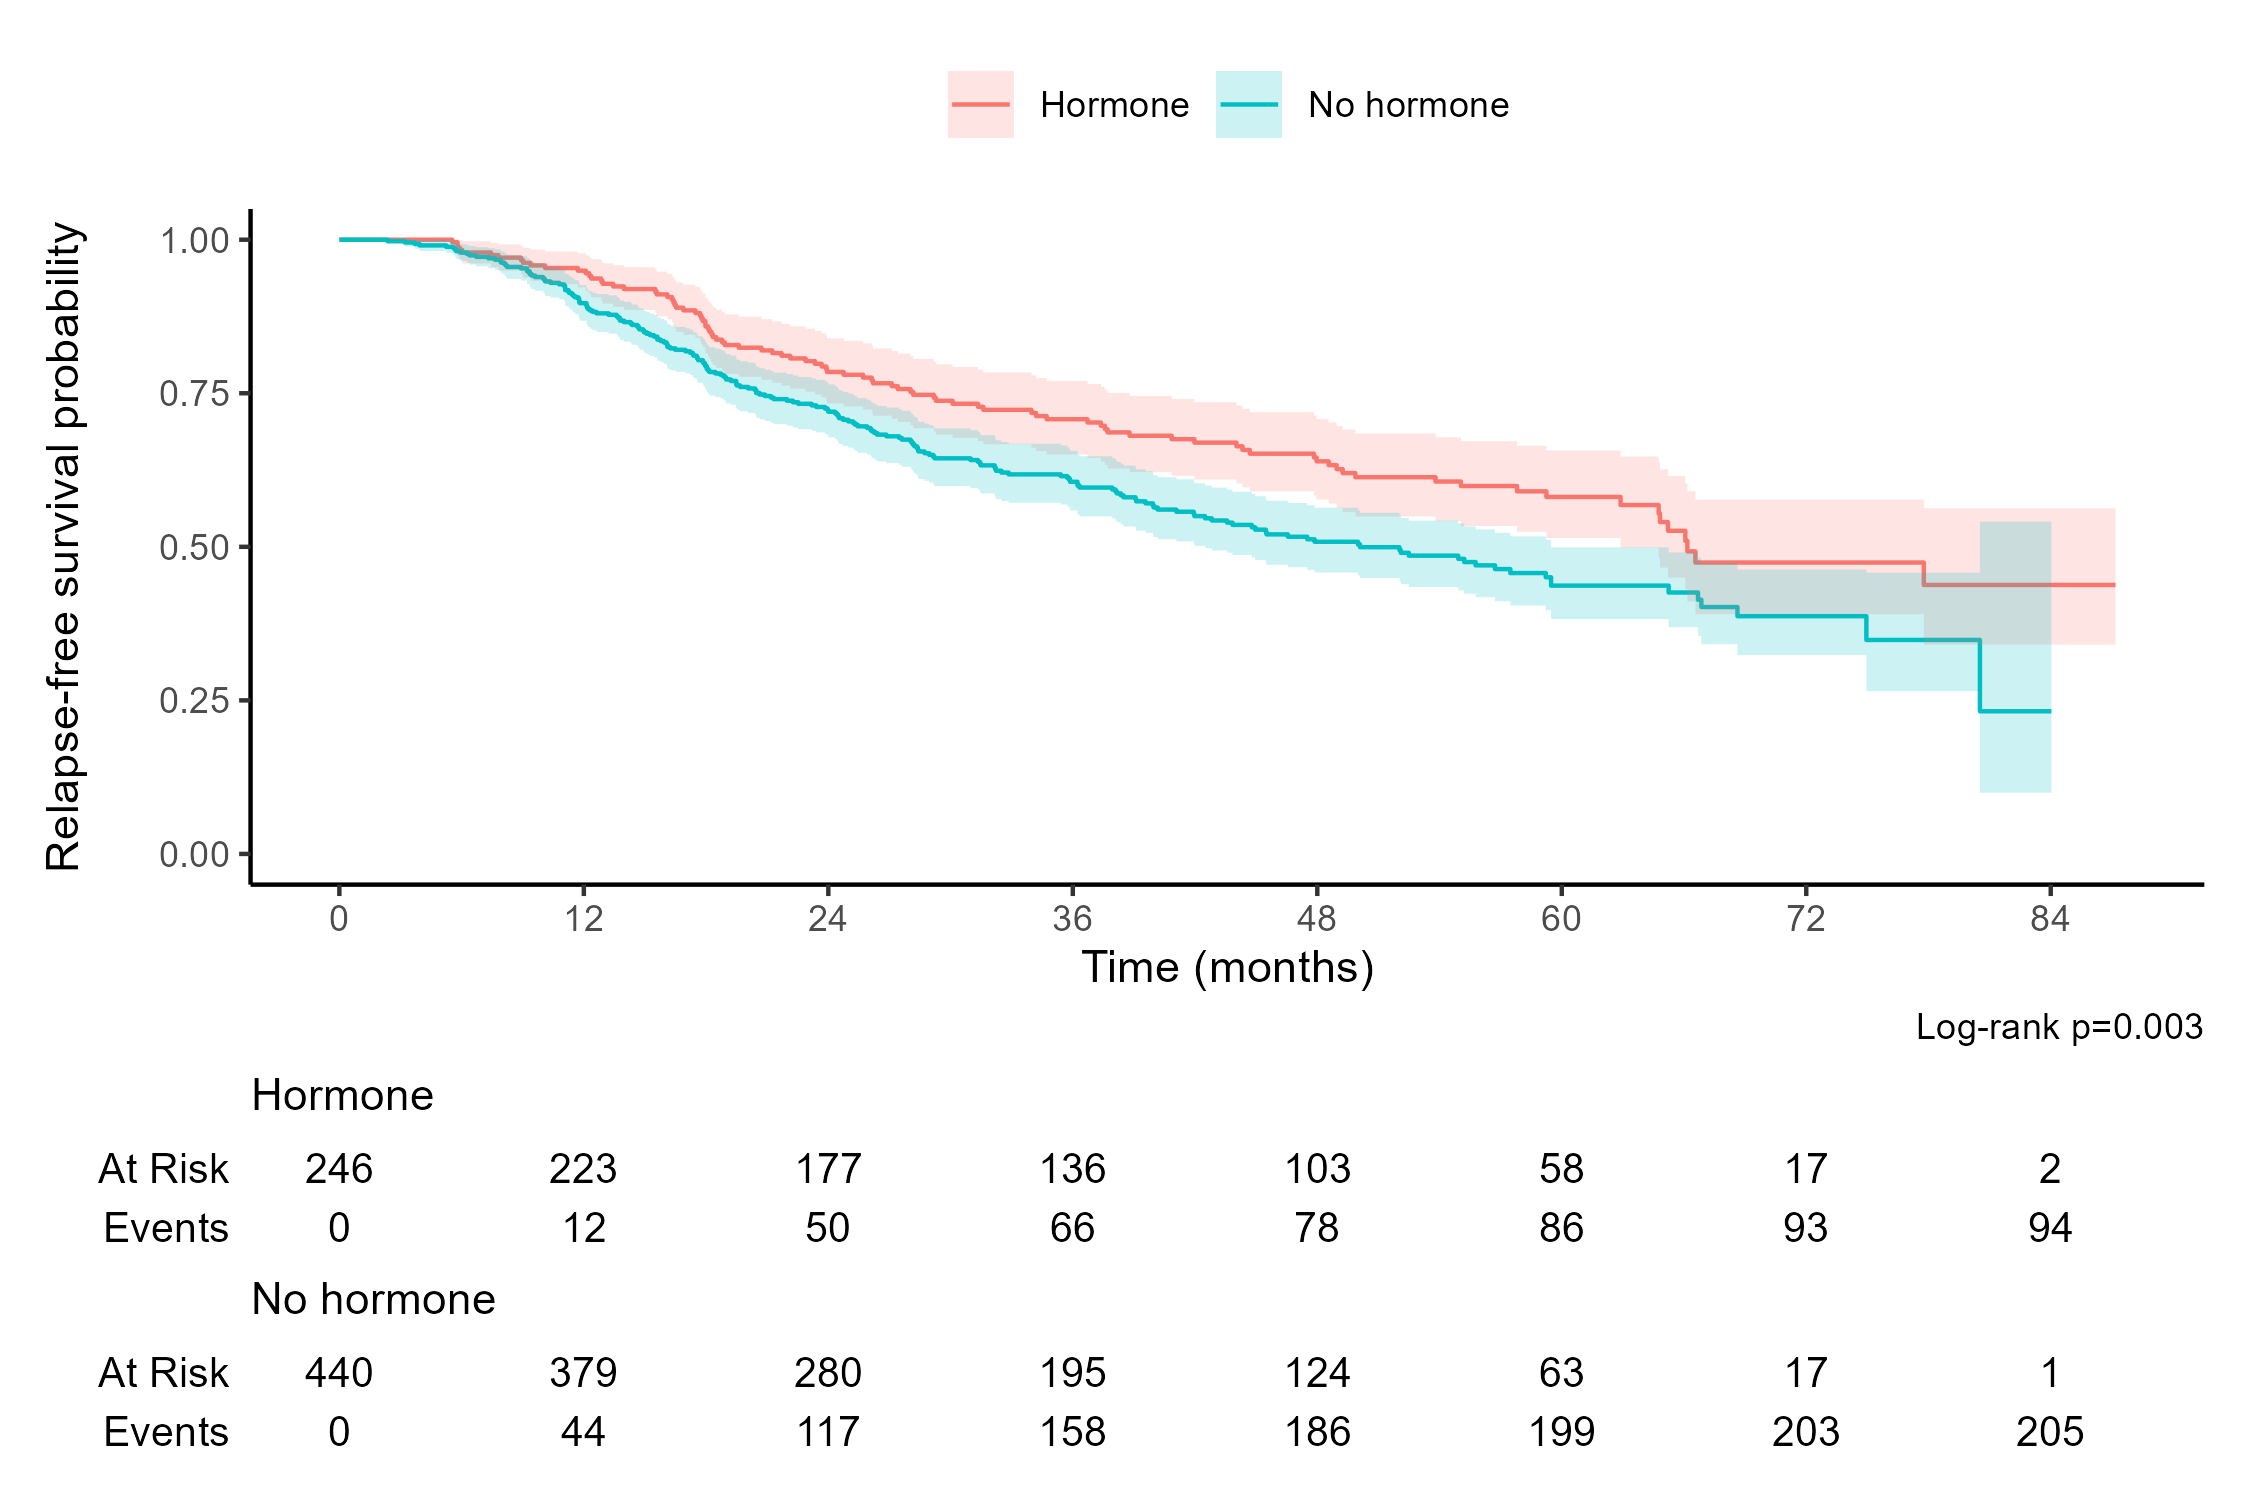
km_fig <- km_fit2 |>     # Plot KM curves with customization
  ggsurvfit() +          # Pass `survfit2` object                       
  add_risktable() +      # Add risk table below the graph
  add_confidence_interval() +   # Add confidence intervals                
  add_pvalue(caption = "Log-rank {p.value}") +  # Add p-value for log-rank test
  scale_x_continuous("Time (months)", breaks = seq(0, 84, 12)) + # x-axis format
  scale_y_continuous("Relapse-free survival probability", limits = c(0, 1)) + # y-axis format
  theme_classic() + # Use classic theme for this ggplot
  theme(legend.position = "top") # Position legend at the top

ggsave("images/km_fig.png", km_fig, width = 7.5, height = 5) # Save the plot

Customization (III)

  • Result

Risk Table Exercise

  • Task: Display only numbers at risk in the risk table
    • Hint: Add risktable_stats = "n.risk" argument in add_risktable()
Solution
km_fit2 |>     # Plot KM curves with customization
  ggsurvfit() +          # Pass `survfit2` object                       
  add_risktable(         # Add risk table below the graph
    risktable_stats = "n.risk" # Show only number at risk
  ) +      
  add_confidence_interval() +   # Add confidence intervals                
  add_pvalue(caption = "Log-rank {p.value}") +  # Add p-value for log-rank test
  scale_x_continuous("Time (months)", breaks = seq(0, 84, 12)) + # x-axis format
  scale_y_continuous("Relapse-free survival probability", limits = c(0, 1)) + # y-axis format
  theme_classic() + # Use classic theme for this ggplot
  theme(legend.position = "top") # Position legend at the top

Add Quantiles (I)

  • Add quantile estimates to the plot
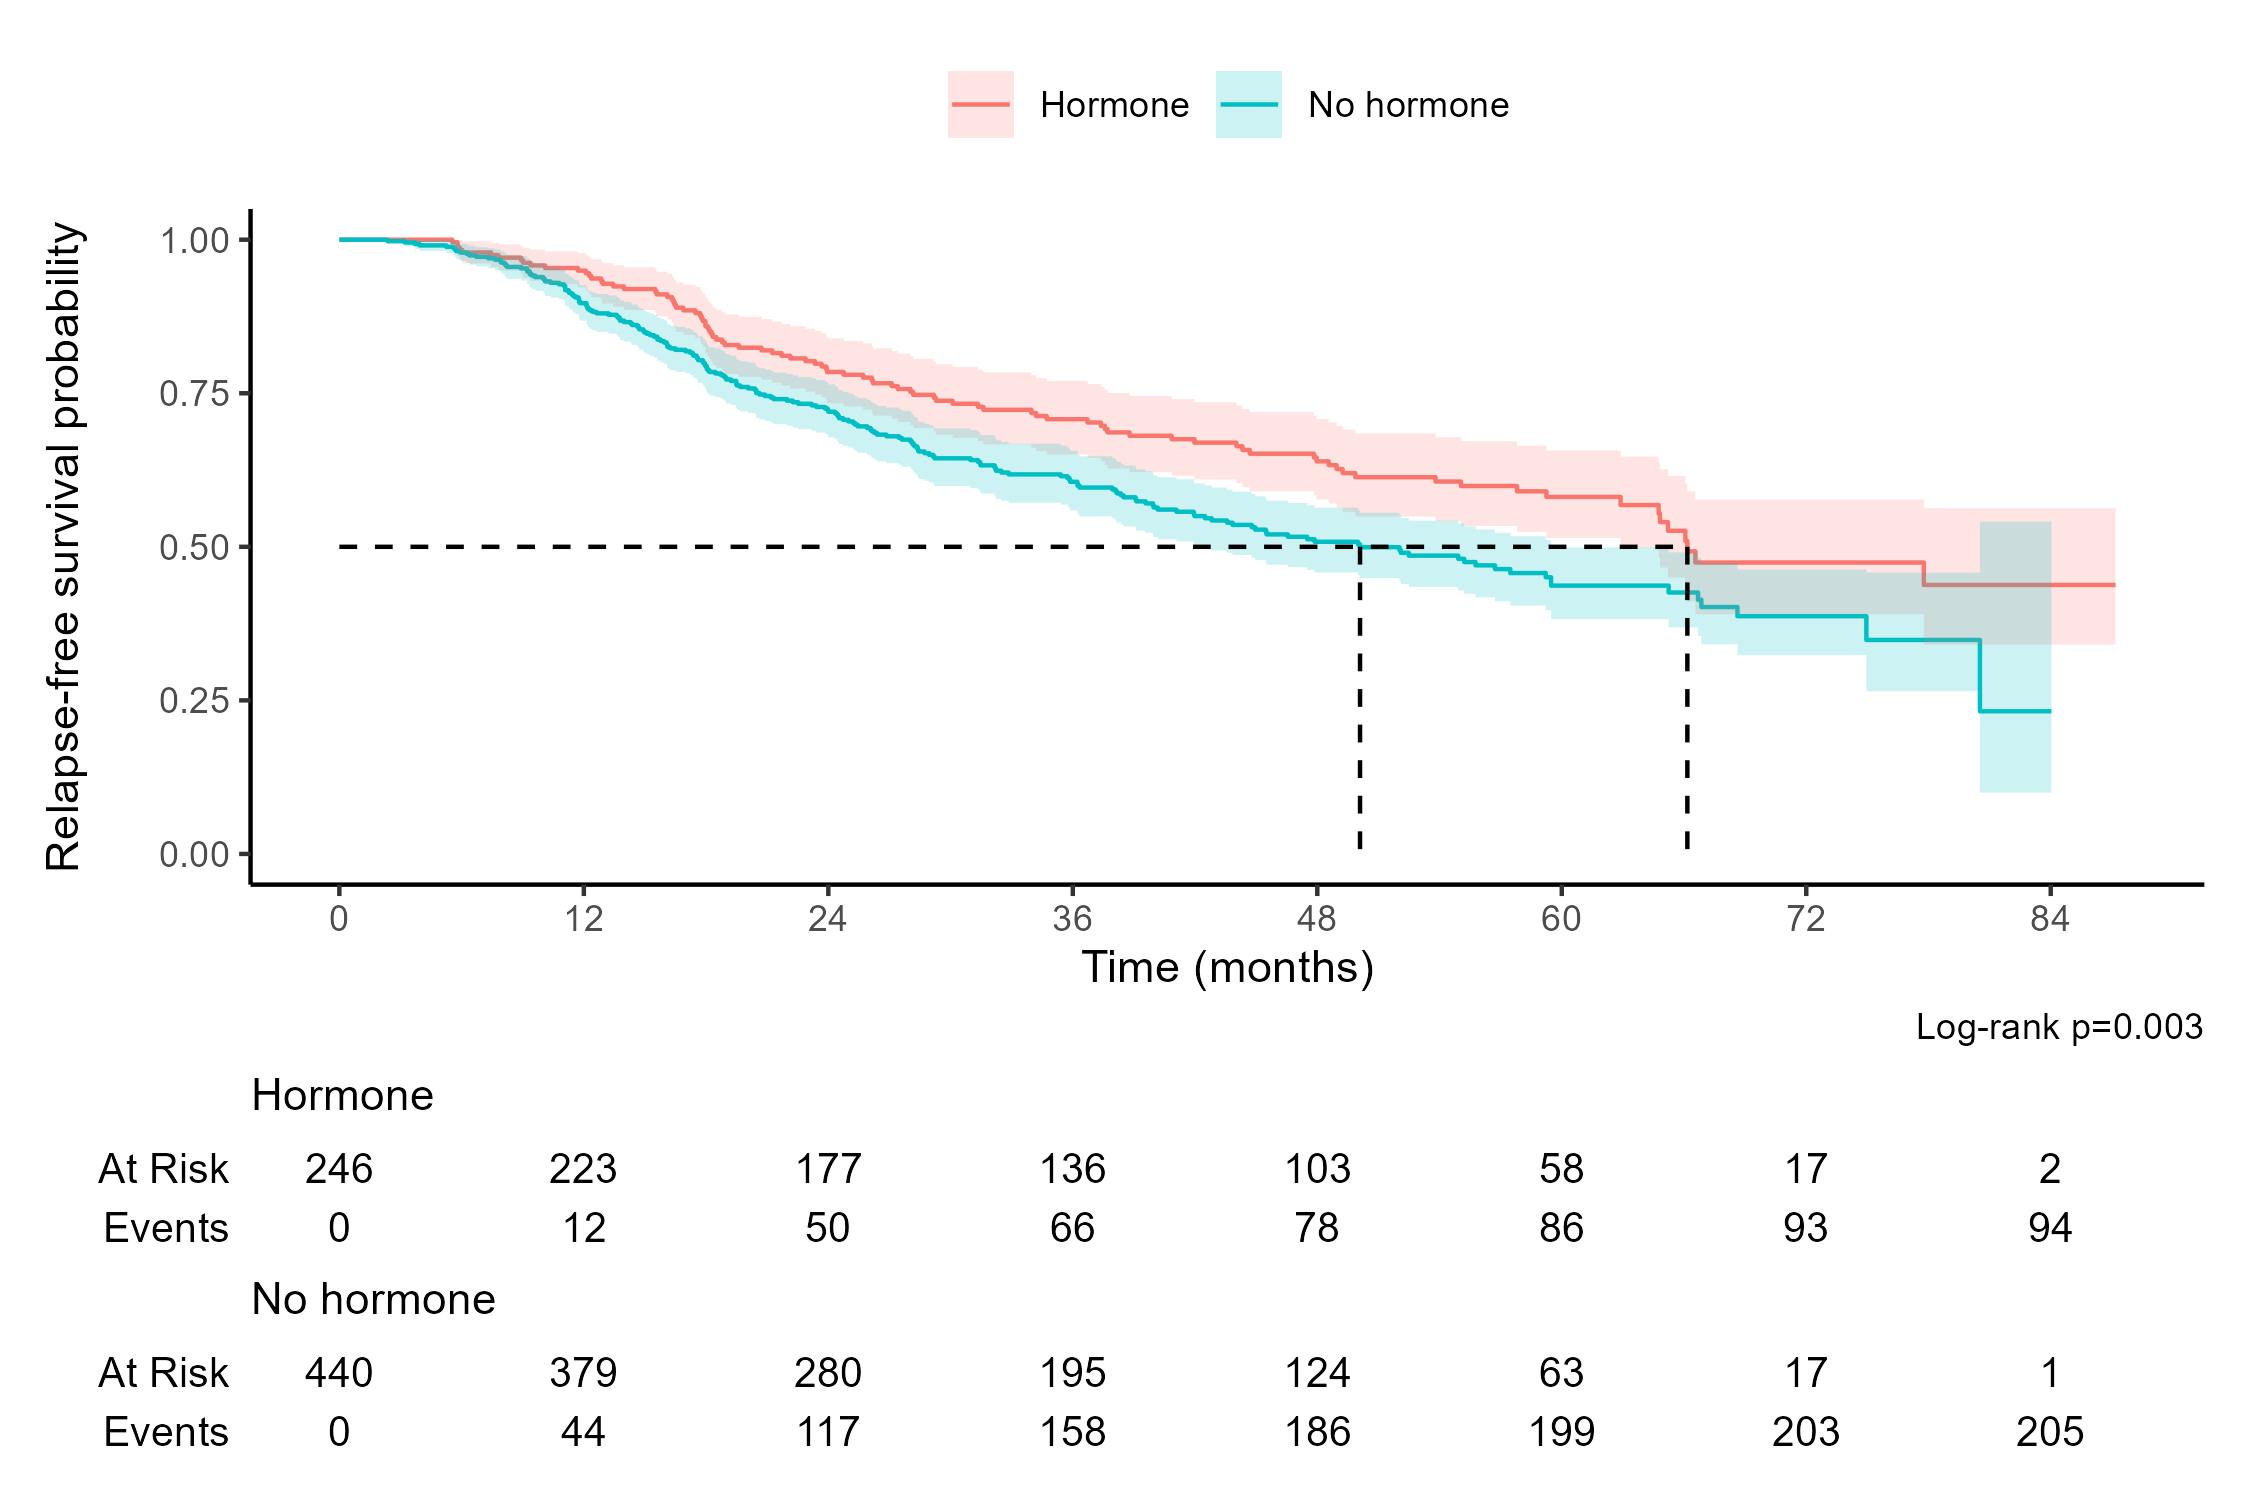
    • Use add_quantile() to add median survival time and other quantiles
    • Specify y_value or x_value arguments for desired quantiles or time points
km_fig + add_quantile(
    y_value = 0.5, # Add median survival time
  )

Add Quantiles (II)

  • Result

Exercise: Add Time Points

  • Task: Add reference lines at 72 months

    • Use add_quantile() with x_value argument
Solution
km_fig + add_quantile(
   x_value = 72 # Add 72-month reference lines
  )

Further Customizations

  • Customize the plot further
    • add_risktable_strata_symbol(...): Use symbols for strata in the risk table
      • symbol = NULL, size = 15, face = "bold", etc.
    • add_censor_mark(...): Add censor marks to the survival curve
      • size = 3, shape = 3, color = "black", etc.
  • More about ggsurvfit

Tidy Analysis of Competing Risks

Competing Risks Overview

  • Competing risks
    • Subject may experience at most one of multiple distinct types of event
    • E.g., death from different causes; relapse vs. death in remission (before relapse)
  • Notation: \((T, \Delta)\)
    • \(T\): time to event
    • \(\Delta\): event type indicator (e.g., 1 for relapse, 2 for death)
  • Quantity of interest
    • Cumulative incidence function (CIF), or sub-distribution \[ F_k(t) = P(T \leq t, \Delta = k) \]
      • Cumulative probability of event type \(k\) by time \(t\)

tidycmprsk Package

  • Analysis of CIF implemented in cmprsk package
    • A “tidy” version is available in tidycmprsk package
    • Simple interface, plays nicely with gtsummary and ggsurvfit
    • Input data: status must be a factor, with the first level indicating censoring and subsequent levels the competing risks
library(tidycmprsk) # Load tidycmprsk package
data("trial", package = "tidycmprsk") # Load trial data from tidycmprsk package
head(trial) # Display the first few rows of the data
# A tibble: 6 × 9
  trt      age marker stage grade response death death_cr           ttdeath
  <chr>  <dbl>  <dbl> <fct> <fct>    <int> <int> <fct>                <dbl>
1 Drug A    23  0.16  T1    II           0     0 censor                24  
2 Drug B     9  1.11  T2    I            1     0 censor                24  
3 Drug A    31  0.277 T1    II           0     0 censor                24  
4 Drug A    NA  2.07  T3    III          1     1 death other causes    17.6
5 Drug A    51  2.77  T4    III          1     1 death other causes    16.4
6 Drug B    39  0.613 T4    I            0     1 death from cancer     15.6

Nonpametric Inference

  • Gray’s estimator and test
# Fit cumulative incidence function (CIF) for competing risks
cif_fit <- cuminc(Surv(ttdeath, death_cr) ~ trt, trial)
cif_fit # print results
#> • Failure type "death from cancer"
#> strata   time   n.risk   estimate   std.error   95% CI          
#> Drug A   5.00   97       0.000      0.000       NA, NA          
#> Drug A   10.0   94       0.020      0.014       0.004, 0.065    
#> Drug A   15.0   83       0.071      0.026       0.031, 0.134    
#> Drug A   20.0   61       0.173      0.039       0.106, 0.255    
#> Drug B   5.00   102      0.000      0.000       NA, NA          
#> Drug B   10.0   95       0.039      0.019       0.013, 0.090    
#> Drug B   15.0   75       0.167      0.037       0.102, 0.246    
#> Drug B   20.0   55       0.255      0.043       0.175, 0.343 

Raw Output

  • Raw output from cuminc() continued
#> • Failure type "death other causes"
#> strata   time   n.risk   estimate   std.error   95% CI          
#> Drug A   5.00   97       0.010      0.010       0.001, 0.050    
#> Drug A   10.0   94       0.020      0.014       0.004, 0.065    
#> Drug A   15.0   83       0.082      0.028       0.038, 0.147    
#> Drug A   20.0   61       0.204      0.041       0.131, 0.289    
#> Drug B   5.00   102      0.000      0.000       NA, NA          
#> Drug B   10.0   95       0.029      0.017       0.008, 0.077    
#> Drug B   15.0   75       0.098      0.030       0.050, 0.165    
#> Drug B   20.0   55       0.206      0.040       0.133, 0.289    
#> 
#> • Tests
#> outcome              statistic   df     p.value    
#> death from cancer    1.99        1.00   0.16       
#> death other causes   0.089       1.00   0.77       

Tidy Output in tibble

  • Use broom to tidy cuminc object
    • Useful for further analysis or visualization
tidy_cif <- tidy(cif_fit) # Tidy the CIF fit object
head(tidy_cif) # Display the first few rows of the tidy data
# A tibble: 6 × 12
   time outcome      strata estimate std.error conf.low conf.high n.risk n.event
  <dbl> <chr>        <fct>     <dbl>     <dbl>    <dbl>     <dbl>  <int>   <int>
1  0    death from … Drug A   0         0      NA         NA          98       0
2  3.53 death from … Drug A   0         0      NA         NA          98       0
3  5.33 death from … Drug A   0         0      NA         NA          97       0
4  6.32 death from … Drug A   0         0      NA         NA          97       0
5  7.27 death from … Drug A   0.0102    0.0102  8.84e-4    0.0503     97       1
6  7.38 death from … Drug A   0.0204    0.0144  3.90e-3    0.0652     96       1
# ℹ 3 more variables: n.censor <int>, cum.event <int>, cum.censor <int>

Exercise

Tabulate CIF estimates with 95% confidence intervals at 5, 10, 15, and 20 months for each risk.

Tabulating CIF Estimates (I)

  • Use tbl_cuminc() to create a table of CIF estimates
    • Similar syntax to tbl_survfit()
    • times: time points for estimates
    • outcomes: specify outcomes to include in the table (Default is the first outcome)
# Tabulate CIF estimates with 95% confidence intervals
cif_fit |> # Pass `tidycuminc` object
  tbl_cuminc(
    outcomes = c("death from cancer", "death other causes"), # Specify outcomes
    times = c(10, 15, 20), # Time points for estimates
    label_header = "Month {time}" # Column label: "Month xx"
  )|> 
  add_p() # Add p-values from Gray's test

Tabulating CIF Estimates (II)

  • Result
Characteristic Month 10 Month 15 Month 20 p-value1
death from cancer
Chemotherapy Treatment


0.2
    Drug A 2.0% (0.39%, 6.5%) 7.1% (3.1%, 13%) 17% (11%, 26%)
    Drug B 3.9% (1.3%, 9.0%) 17% (10%, 25%) 25% (17%, 34%)
death other causes
Chemotherapy Treatment


0.8
    Drug A 2.0% (0.39%, 6.5%) 8.2% (3.8%, 15%) 20% (13%, 29%)
    Drug B 2.9% (0.79%, 7.7%) 9.8% (5.0%, 17%) 21% (13%, 29%)
1 Gray’s Test

CIF Graphics (I)

  • Plot CIF estimates with ggsurvfit::ggcuminc()
    • Similar syntax to ggsurvfit()
    • outcome: specify outcome to plot
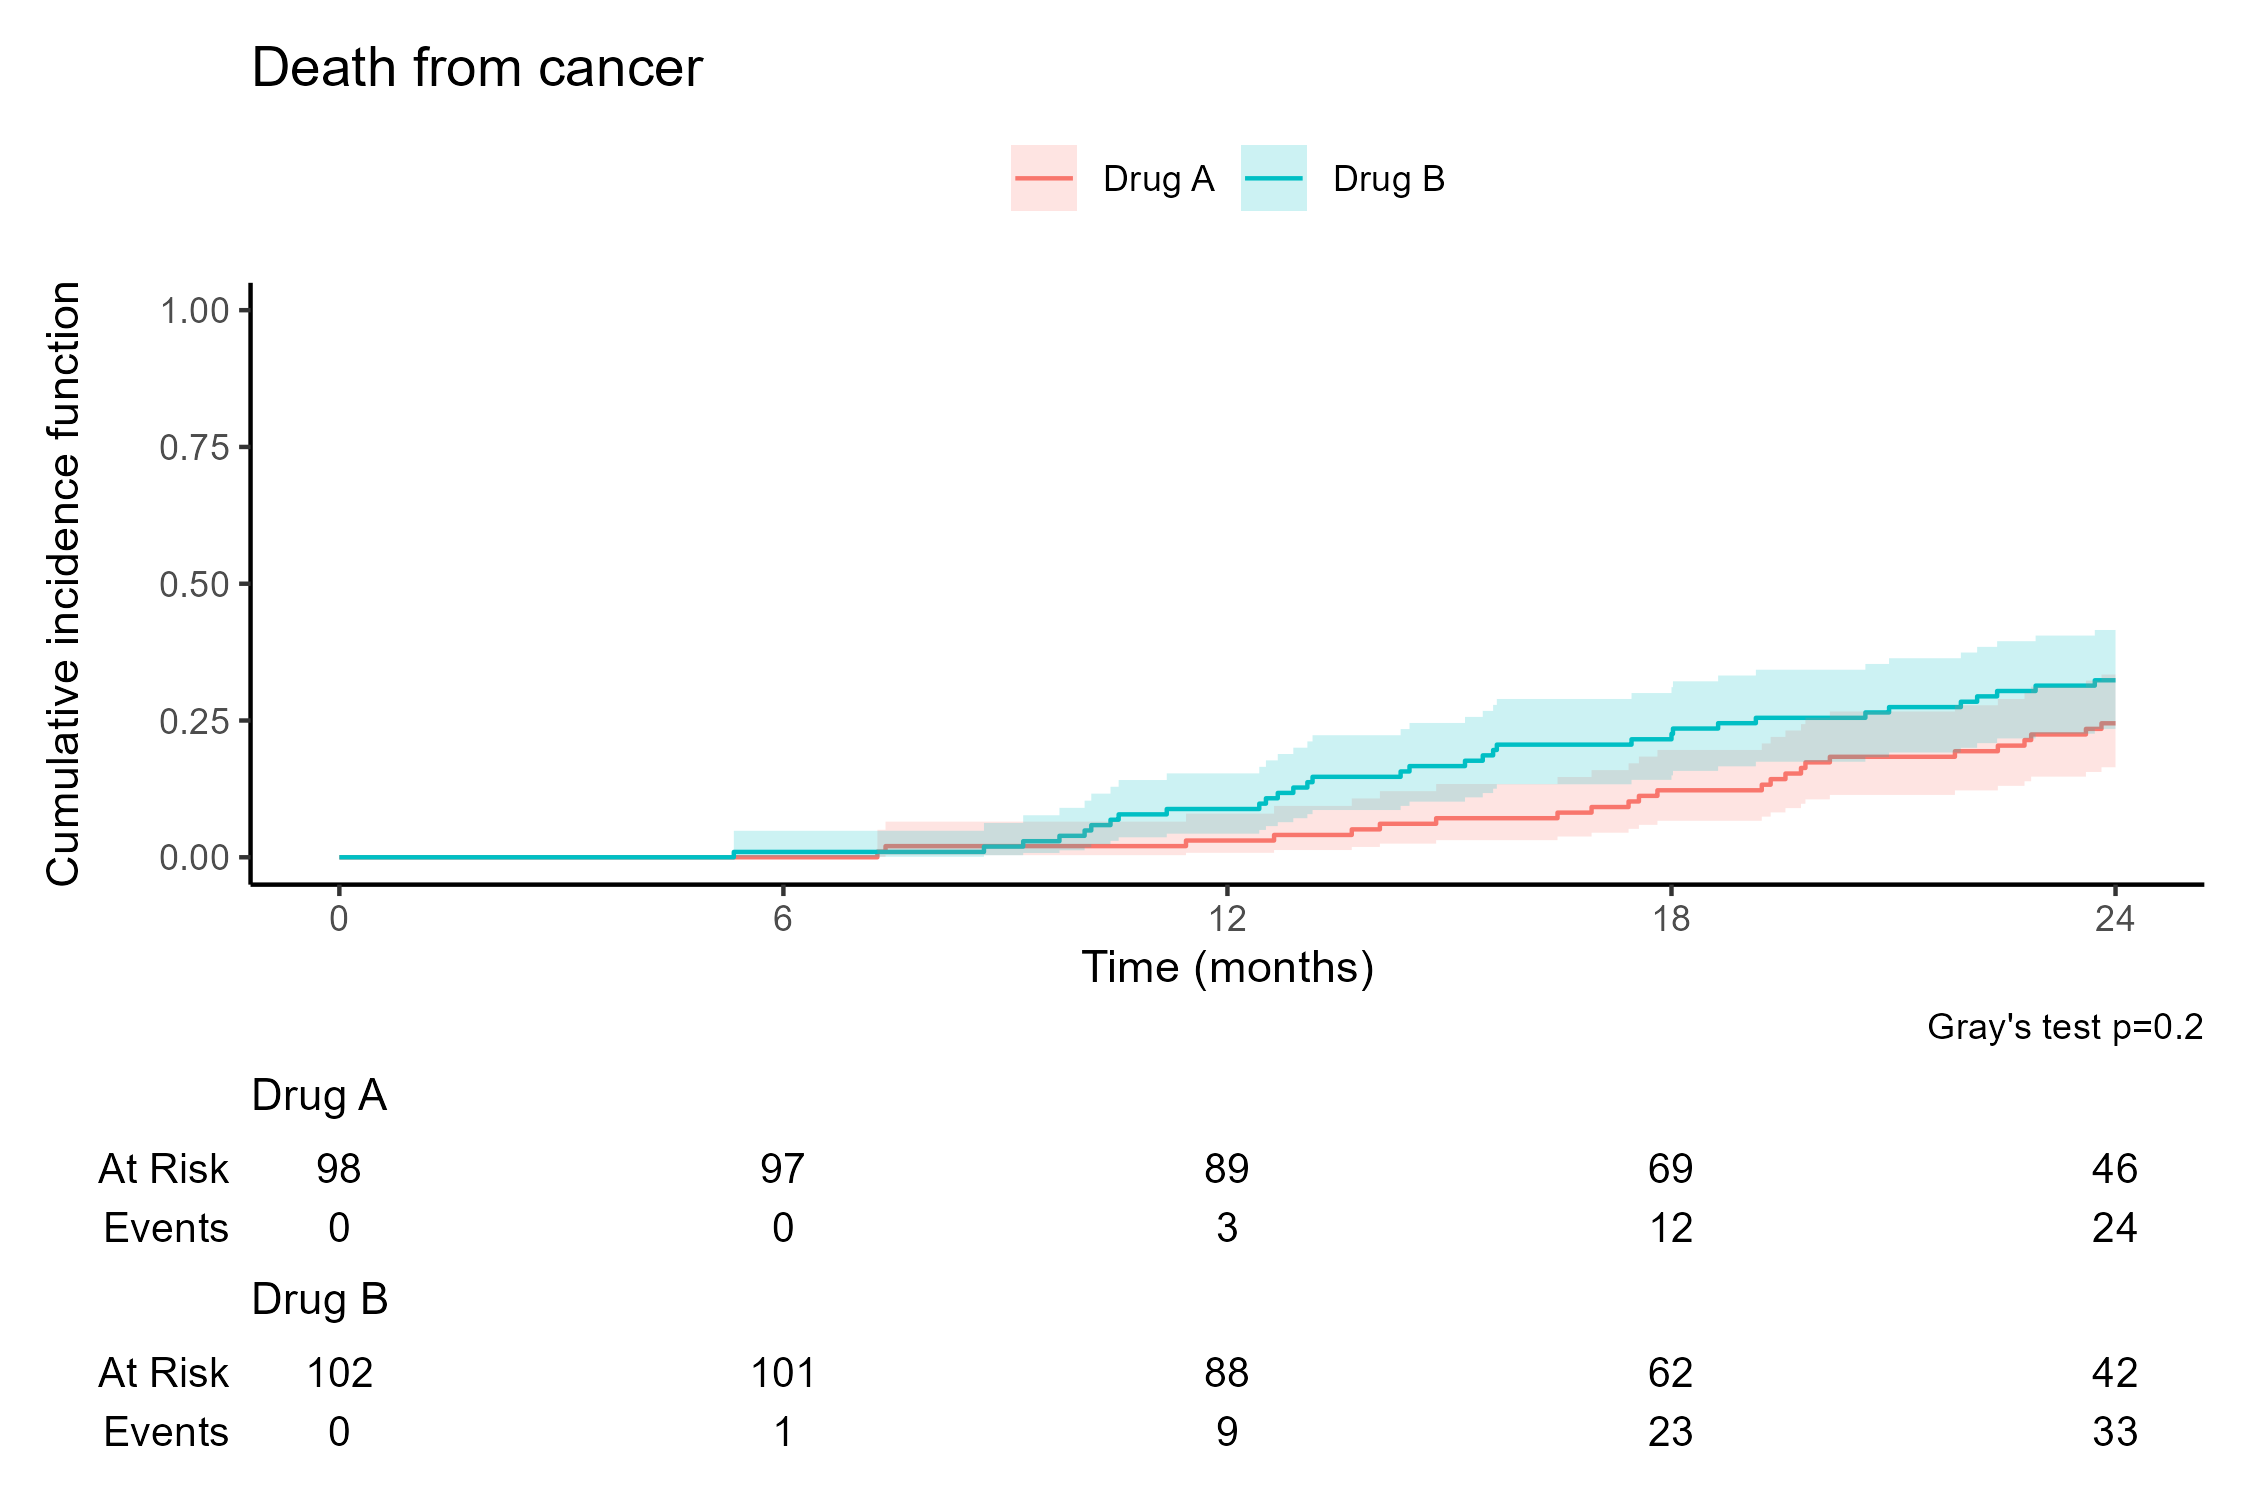
cif_fit |> # Pass `tidycuminc` object
  ggcuminc(outcome = "death from cancer") + # Plot CIF for "death from cancer"
  add_confidence_interval() + # Add confidence intervals
  add_risktable() + # Add risk table below the graph
  add_pvalue(caption = "Gray's test {p.value}") + # Add p-value for Gray's test
  scale_x_continuous("Time (months)", breaks = seq(0, 24, 6)) + # x-axis format
  scale_y_continuous("Cumulative incidence function", limits = c(0, 0.5)) + # y-axis format
  ggtitle("Death from cancer") + # Title
  theme_classic() + # Use classic theme for this ggplot
  theme(legend.position = "top") # Position legend at the top

CIF Graphics (II)

  • Result

CIF Graphics Exercise (I)

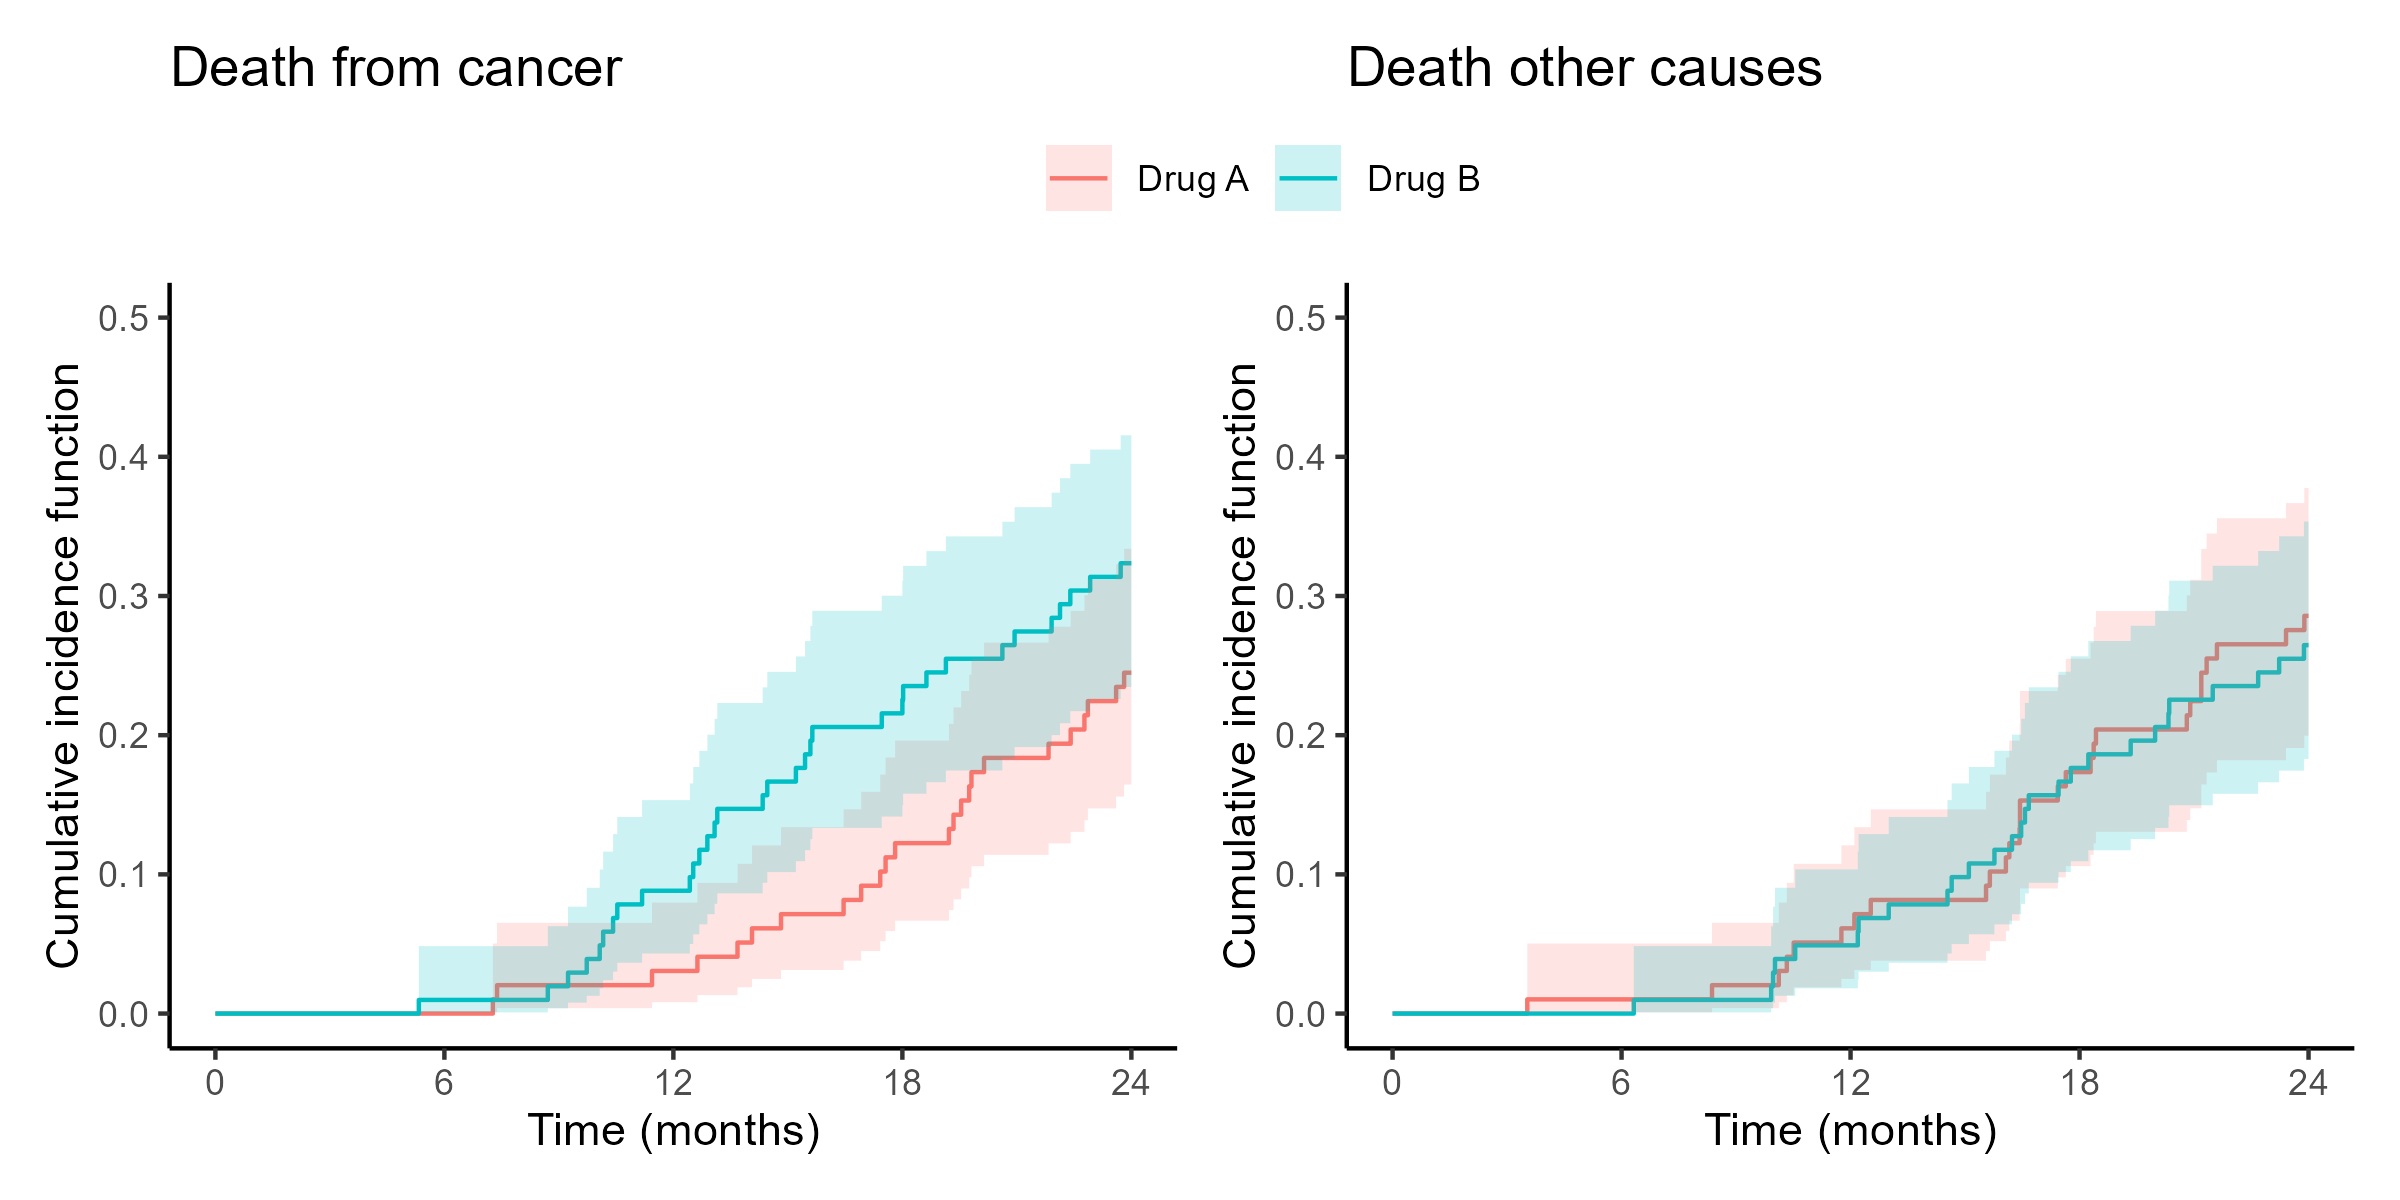
  • Task: create the figure below
    • Hint: plot separate figures for each outcome and use patchwork to combine them

CIF Graphics Exercise (II)

Solution
# Function to create CIF plot for a given outcome
cif_plot <- function(cif_fit, outcome){
  cif_fit |> # Pass `tidycuminc` object
    ggcuminc(outcome = outcome) + # Plot CIF for specified outcome
    add_confidence_interval() + # Add confidence intervals
    scale_x_continuous("Time (months)", breaks = seq(0, 24, 6)) + # x-axis format
    scale_y_continuous("Cumulative incidence function", limits = c(0, 0.5)) + # y-axis format
    ggtitle(str_to_sentence(outcome)) + # Title by capitalizing initial of first word in outcome
    theme_classic() + # Use classic theme for this ggplot
    theme(legend.position = "top") # Position legend at the top
  
}

cif_cancer_plot <- cif_plot(cif_fit, "death from cancer") # Plot for "death from cancer" 
cif_other_plot <- cif_plot(cif_fit, "death other causes") # Plot for "death other causes"

library(patchwork) # Load patchwork package
# Combine the two plots with patchwork
cif_trial <- cif_cancer_plot + cif_other_plot + plot_layout(guides = "collect") &
  theme(legend.position = "top") # Collect legends and position at the top

Summary

Key Takeaways

  • Nonparametric survival analysis
    • Use survival::survfit() for Kaplan-Meier estimates
    • Use tidycmprsk::cuminc() for CIF of competing risks
  • Tidy outputs
    • Use broom::tidy() to convert survfit and tidycuminc objects into tidy data frames
  • Tabulation and visualization
    • Use gtsummary::tbl_survfit() and tidycumprsk::tbl_cuminc() for tabulating survival estimates
    • Use ggsurvfit::ggsurvfit() and ggsurvfit::ggcuminc() for visualizing survival curves and CIF

Next Steps

  • Cox regression analysis
    • Tidy and format results from survival::coxph()
    • Visualize prediction results
  • Competing risks
    • Proportional sub-distribution hazards (Fine-Gray) regression
    • Tabulation and graphics